Backstage And Microservice Dependency Graphing With GToolkit
November 20, 2021
Intro
For a good sized microservice herd it’s important to know how these services relate to each other. How much internal traffic does X service get, what’s the order of the microservices from the user’s request point of view, etc etc.
Drawing this diagram shouldn’t, but often is, engineers “just knowing” the system in their heads then putting it down on paper. Ok cool, but can you take a configuration in code and turn that into a diagram instead?
If you have published information about your services in some kind of service definition file - like Backstage’s service catalog encourages you to do - you’re half way there: you can query the items themselves for what services they consume.
If we have this relational data how do we graph it? Can we graph it in a way where we can move nodes in the graph around (in case computer layout has obscured some text, or doesn’t get the order quite right?) Can we query / select only parts of our datasource and graph them? Perhaps only cliques of the microservice herd?
In this article I’m going to use GToolkit to parse and graph this data, and provide a plain ol’ Pharo way also (as that has some advantages).
GToolkit introduction
GToolkit is a platform for software development meta-work.
I’ve used GToolkit for:
- Systems documentation, using its notebook style functionality
- Github pull request analysis / status tracking
- I could have used it for Jenkins build analysis and tracking
- Systems architecture projects like what I describe in this blog post.
I may port some of my code from my enterprise javascript analysis Pharo library -> GToolkit’s graphing abilities, and GToolkit has some better tools in this area than I do (there’s an example of it parsing yarn.lock files!). GToolkit is just a layer over Pharo Smalltalk so this wouldn’t be that hard to do.
About Smalltalk The Language / Syntax
Smalltalk as a language is a breath of fresh air, as it provides the bare minimal amount of syntax for a programming language then just stops. The syntax for this language can fit on a postcard, unlike other languages which try to pack tons of syntactical sugar into the language (lookin at you, Ruby and Kotlin…)
The best descriptions of Smalltalk’s syntax are the Smalltalk postcard (all the syntax on a postcard!!!) and the Pharo syntax on a postcard explained Youtube video.
If you’re new to Smalltalk syntax I suggest pulling up the Smalltalk postcard in one browser window and watching the first 5 minutes of the explainer video, comparing and reviewing the two together.
How I used GToolkit to prototype this article
One of GToolkit’s features is a notebook style mode, allowing us to build up complex documents or analysis in an interactive way. This mode is how I did the research for this article, trying things to see if / how they worked.
Notebook pages support text, Smalltalk, pictures, etc etc. The interesting thing about the Smalltalk snippets mode is - unlike Smalltalk itself - you don’t need to declare variables before using them. Variables created and used - aka without using the “temporary variable” syntax - seem to get turned into notebook global variables.
If, in the source code, you see a variable randomly assigned, but you’re not sure where that came from, the answer is “copy and paste directly from the notebook, and this might be the first usage of that variable”
“Waiittt, so what is this Backstage thing?”
Spotify calls its Backstage project “supercharged developer portals”. When describing it to others I tend to call it “service registry for humans”.
The idea is that, given a large development organization Backstage should be where you go to:
- figure out who owns a particular service you want to use
- maybe create a new microservice from a published developer starter pack
- see service documentation (OpenAPI schemas, etc)
For a service owner Backstage lets you publish what APIs you provide, what APIs you consume, additional information about your service, service status and - now - service runtime information.
What we want to do
Let’s take these two tasts that might taste good together and use them to create a diagram: take catalog entries from Spotify, understand what APIs they provide or consume, and build a graph in GToolkit!
Setup
We’ll take a couple liberties here for speed. First we’ll just hard code the Spotify catalog entries, vs readin the YAML from files of retrieving them via web service calls.
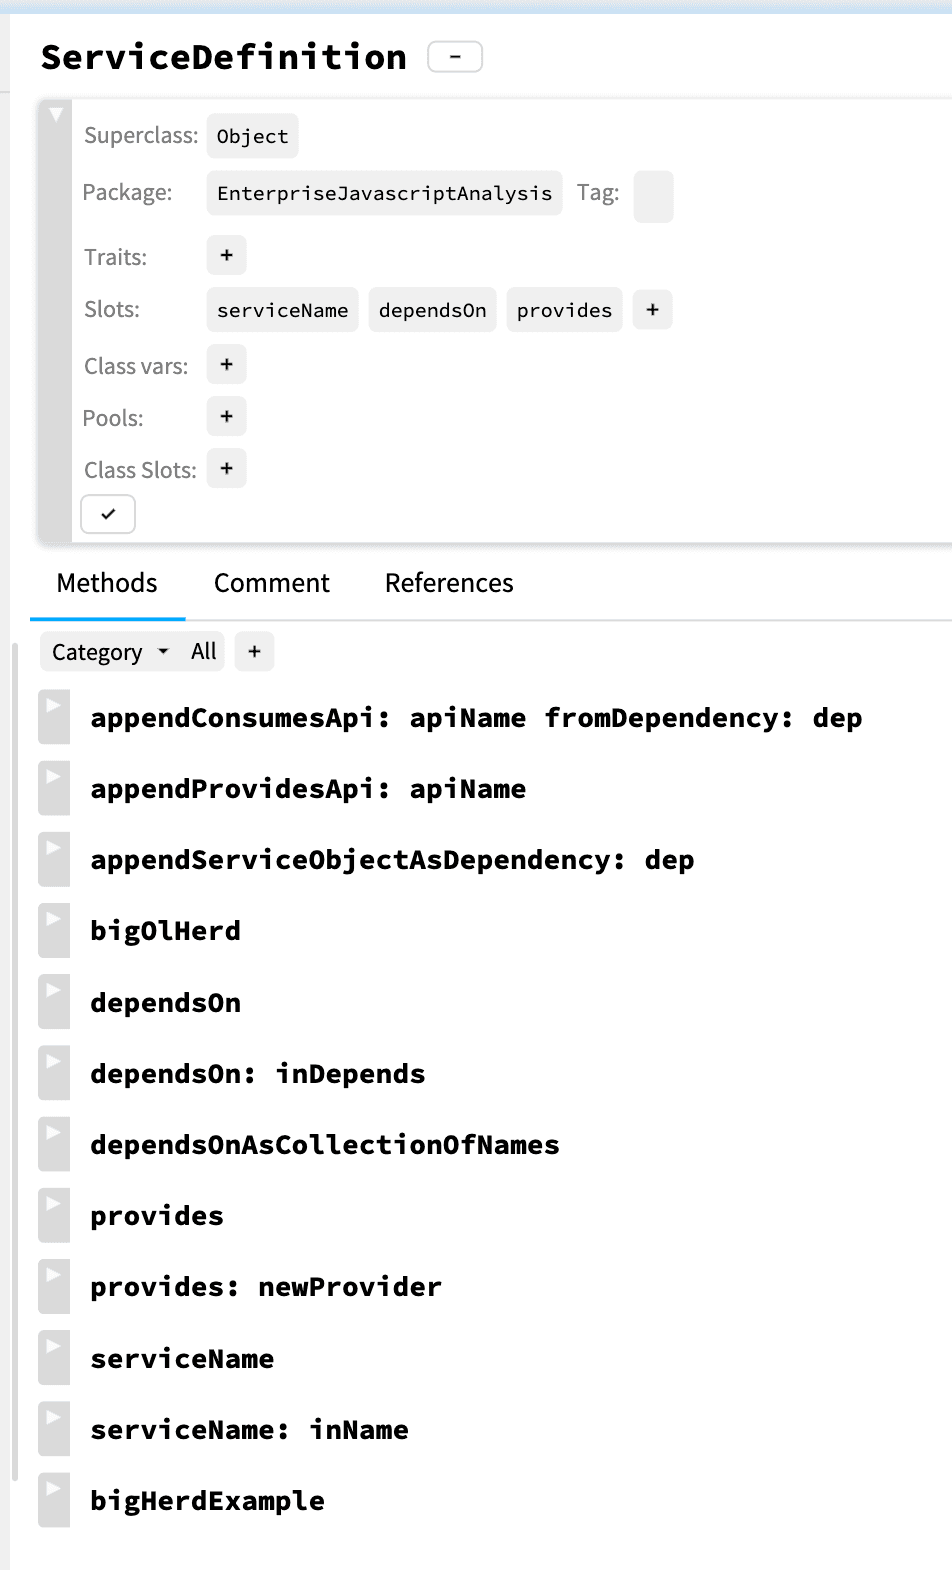
Secondly, I’ve created the ServiceDefinition object off to the side. It’s not to important to the main story - it really just holds service name, provides and depends on instance variables ’ but the source code is on my github.
If you don’t want to read serialized Smalltalk, here’s a picture:
Libraries to load into your GToolkit image
Paste this into a Playground (because you’ll only have to do it once)
Install PetiteParser (2), the branch that works in Pharo 9 (because that seems to be what GT is running on).
Metacello new
   baseline: 'PetitParser';
   repository: 'github://moosetechnology/PetitParser:v3.x.x/src';
   load.
OK cool we’ve installed it. How does it work?
PPYAMLGrammar parse: 'language: foo'Neat!
Parsing Backstage catalog entries
Let’s load up a sample catalog-info.yml file with some dependencies (just hard code the entry for now)
definitionAsDictionary := PPYAMLGrammar parse: 'apiVersion: backstage.io/v1alpha1
kind: Component
metadata:
name: artist-web
description: The place to be, for great artists
spec:
type: website
lifecycle: production
owner: artist-relations-team
system: artist-engagement-portal
consumesApis:
- user-api
providesApis:
- artist-api
'.
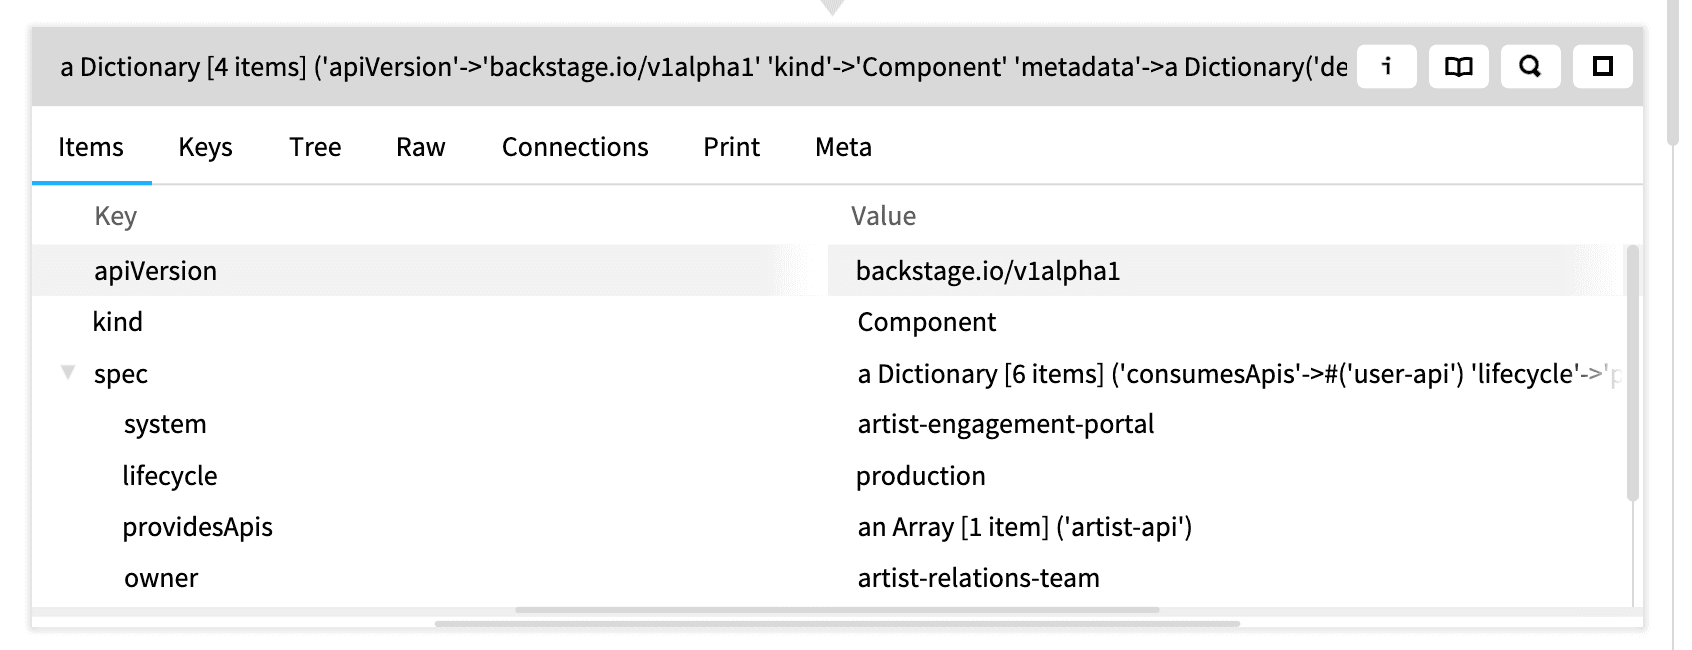
definitionAsDictionary.Inspecting the resulting dictionary gives us a view like so:
In the Backstage software catalog reference they talk about providesApi having potential multiple values for a service catalog. This makes sense as a microservice could support many routes - maybe the entry is more than just a lambda.
Creating sample ServiceDefinitions to form relationships
Let’s make a generic ‘data store’ for all these objects. Really we could put them database and look them up, but for now a global variable will work well enough.
serviceRepository := {} asDictionary.Sidenote: microservice graphs like this feel a natural for a graph datastore, which I’ve played around with before in Pharo via Tinkerpop and Gremlin. I want to play more with backing up meta software analysis in graphs. Perhaps someday.
We link up our definitionDictionary to a ServiceDefinition object in the simplest manner.
|currentServiceName|

currentServiceName := (definitionAsDictionary at: 'metadata' at: 'name').
a := ServiceDefinition new.
a serviceName: currentServiceName.
a provides: (definitionAsDictionary at: 'spec' at: 'providesApis').

serviceRepository at: currentServiceName put: a.
But we haven’t done the consumes relationships yet. Let’s create some more services in our graph structure.
serviceBdefinitions := PPYAMLGrammar parse: 'apiVersion: backstage.io/v1alpha1
kind: Component
metadata:
  name: user-web
  description: Our users
spec:
  type: website
  lifecycle: production
  owner: user-relations-team
  system: artist-engagement-portal
  providesApis:
    - user-api
'.

serviceBdefinitions.|currentServiceName|
currentServiceName := (serviceBdefinitions at: 'metadata' at: 'name').
b := ServiceDefinition new.
b serviceName: currentServiceName.
b provides: (serviceBdefinitions at: 'spec' at: 'providesApis').
serviceRepository at: currentServiceName put: b.ok serviceRepository has two entries in it, the users-api and the artists-api. artists-api depends on users-api. (but doesn’t know it yet).
We could get fancy and iterate the repository looking for patterns, but this is a simple example, let’s hardcode it.
a dependsOn: ( {} asDictionary).
a appendConsumesApi: 'user-api' fromDependency: b.
Cool so inside serviceRepository we have two objects, each of them mapped out correctly.
… But I haven’t adopted Backstage!
At this point, because they are domain objects, theoretically you could have created ServiceDefinition objects out of some home grown service configuration language you’ve created before Backstage was a thing. Ahem.
Graphing with GToolkit
First, quick, turn our repository into an easier to consume shape:
serviceList := {a. b} asOrderedCollection.

"we care about microservices running, not the APIs that they provide. Map those to that"
apiDictionary := Dictionary new.

serviceList do: [:curr |
  curr provides do: [:providesApiName | apiDictionary at: providesApiName put: curr.].
].

apiDictionary.
A side venture into how graphing objects works in GToolkit at all
I didn’t find the GToolkit documentation on this super clear, and it took a bit of head scratching to figure out what was going on here.
|view|

view := GtMondrian new.

view nodes
  shape: [:x | BlTextElement new text: x asString asRopedText];
      "^^^^^ is called once per model object to create the objects on screen"
  with: (1 to: 3).  "iterates over the model objects"

view edges connectToAll: [:in | #(3) asCollection].
"connectTo all is called for each node in the list and connects to the
model object(s) you specify
You could also use a symbol name instead of a closure here
"

view layout horizontalDominanceTree.
view
view nodes creates a node builder object with couple of methods on it. The most interesting method is shape:with:.
The with parameter takes an iterable (or block) of your domain objects. HERE we are counting numbers.
The shape block receives the current domain object and returns the BlElement representation of that domain object.
Now that all of objects are on the graph we need to join them together. view edges creates an edge builder object, which provides a connectToAll method, which receives a domain object, and you return an iterable of all the domain objects your current one connects to.
This is very declarative way to build a graph, and takes some brain wrapping a bit, but does build it in a very compact way compared to other more imperative ways (like Roassal’s API).
Applied to our problem
Now let’s apply this to our service graph. We want to graph the relationship services, not APIs, have to each other - we want to know when a microservice has lots of dependencies.
|view|

view := GtMondrian new.

view nodes
  shape: [:x | BlTextElement new text: x serviceName asRopedText];
  with: serviceList.

"iterates over the model objects"
view edges connectToAll: [:inServiceDefinition | |connectToList|
  "for each API we depend on, give us the appropriate ServiceDefinition object"
  inServiceDefinition dependsOnAsCollectionOfNames collect: [:currentDependsOn | apiDictionary at: currentDependsOn ].
].


view layout horizontalDominanceTree.
view
Gives us the resulting graph
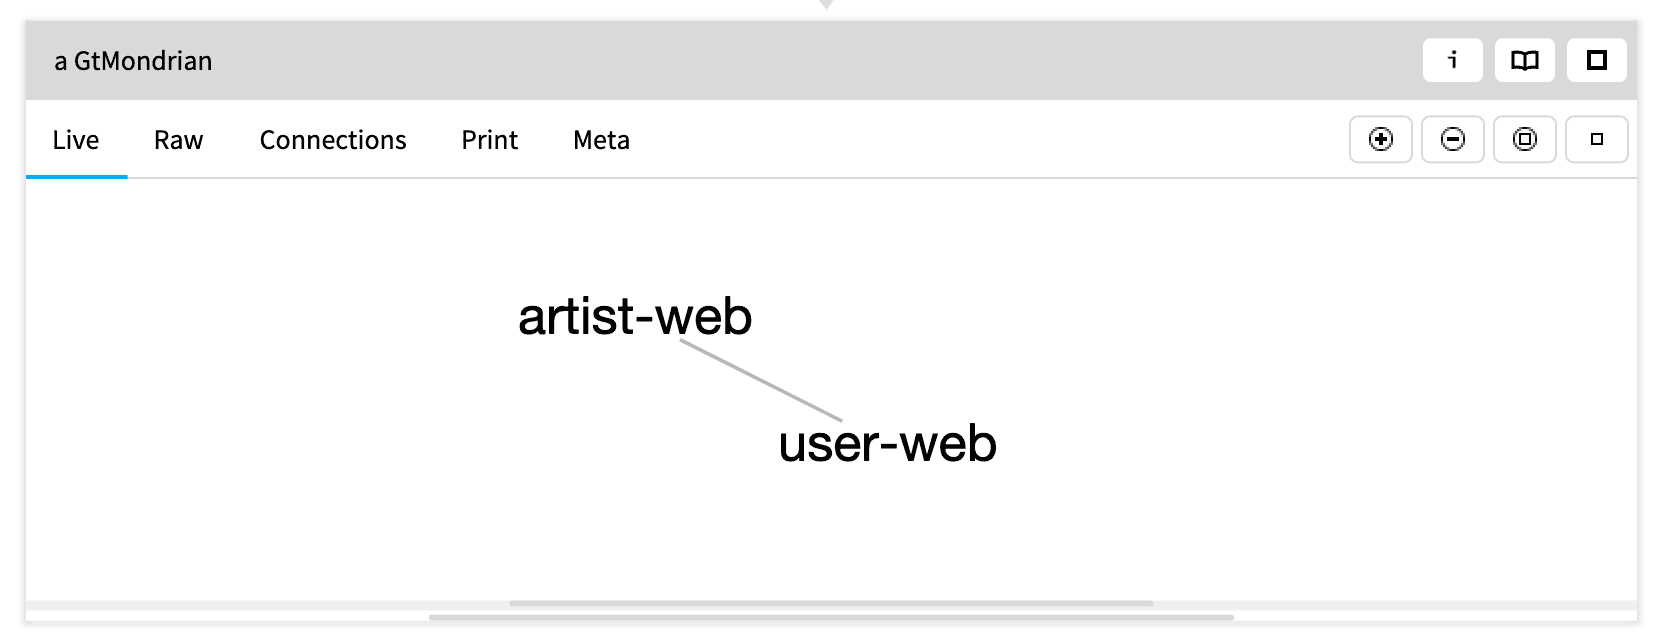
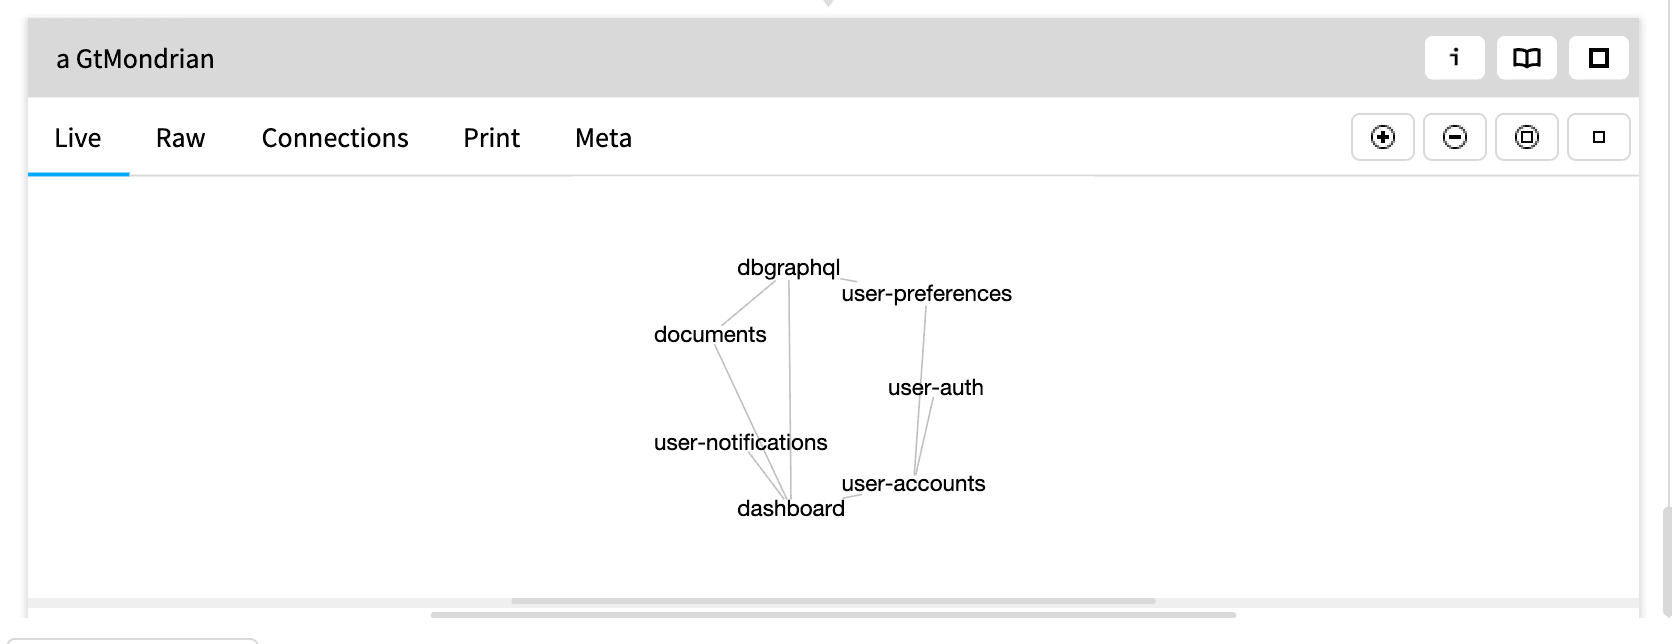
This looks… unimpressive. Let’s see a whole, made up, herd.
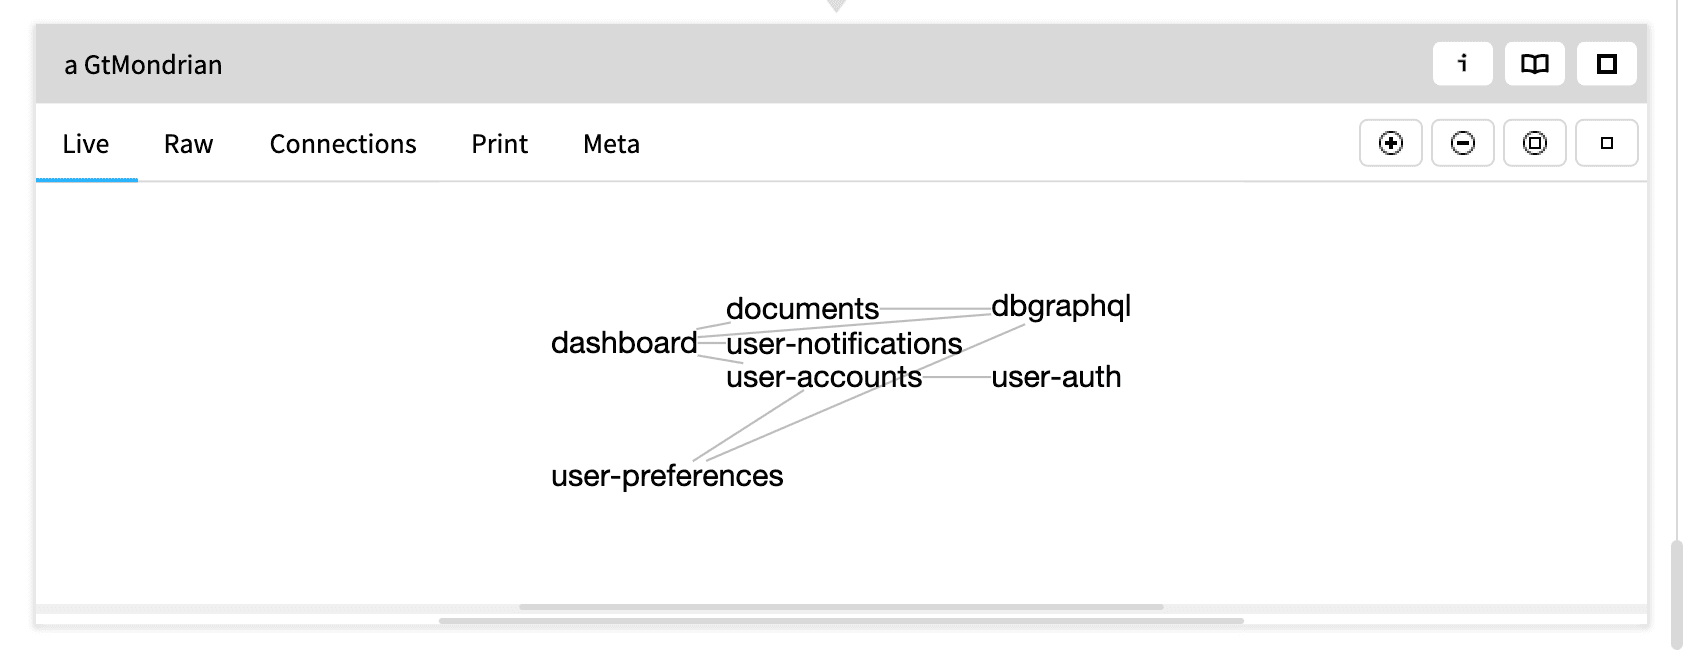
But we want a network graph “Deathstar”
Use circle as the layout, not horizontalDominanceTree
Graphing with plain ol’ Pharo
GToolkit provides its own interface over Pharo. There’s some disadvantages here as it doesn’t support the old Roassal ways of graphing. Those ways are really good, providing several export formats for a graph: SVG, PNG and even interactive HTML are supported out of the box.
So it’s worth knowing, and using, especially if you want to export interactive HTML to your non Pharo/GToolkit using colleagues.
(This work is based on Roassal 2. It’s a relatively trivial port to RS3.)
For this to work we add a new method to ServiceDefintion,
asRTCompositeShape
| currShape currLabel outShape|
	currShape := RTCompositeShape new.
	currLabel := RTLabel
		new;
		text: serviceName yourself.
	currShape add: currLabel.
	currShape setAutomaticRelayout.

	outShape := currShape elementOn: self.

	outShape @ RTDraggable .
	outShape @ (RTPopup new text: [ :entry |
		'id = ', serviceName, String cr,
		'requires = ', (self dependsOn asCommaString), String cr]).

	^ outShape
Because we can’t just graph this in GToolkit, we have to use plain ol’ Pharo’s playground, or create a class for graphs and add this as a method. Whichever way, we have the code to graph it.
Note: I’m reasonably sure this code works, but I’ve taken less care in this area than others. If you are going to actually run this code there may be some debugging involved. Added this last section on a whim and weeeelllll…
| view keysAndShapes|

	keysAndShapes := Dictionary new.

	view := RTView new.
	view @ RTDraggableView.

	"first create all of our outer objects"
	serviceList keysAndValuesDo: [ :keyStr :currMicroserviceObject || currShape|
		currShape := currMicroserviceObject asRTCompositeShape.
		view add: currShape.
		keysAndShapes at: keyStr put: currShape.
	 ].

	 "now wire up all the edges to the depdencies"
	inDict keysAndValuesDo: [ :keyStr :currMicroservicesObject|| currMicroserviceShape microserviceColor|
		currMicroserviceShape := keysAndShapes at: keyStr.

		microserviceColor := Color random.
		currMicroservicesObject dependsOn keysAndValuesDo: [ :keyStr, :currDepMicroservice ||depShape edge|
			depShape := keysAndShapes at: (currDepMicroservice key).

			edge := (RTEdge from: currMicroserviceShape to: depShape).
			edge + (RTLine new color: microserviceColor) + (RTSimpleArrowHead new color: microserviceColor).
			view add: edge

		].
	].

	RTHorizontalDominanceTreeLayout     new on: (view elements) .
	"get a death star by using RTEquidistantCircleLayout here"

	^ view.
Conclusion
Microservice graphs are great, but they’re extra useful when generated from documentation developers should be updating anyway, because it’s a configuration as code language.
Likewise, analysis tools are great too! Especially moldable development environments where any query is a couple of lines of code away. Before graphing we could select only microservices created by a certain team, or of a certain type, or get very clever and turn ServiceDefintion objects into browsable, navigable objects in GToolkit’s inspector.
It’s wonderful when we can bring standards together to generate something helpful, good, benefiting the understanding of all developer’s on the project.